Kubernetes Troubleshooting: The Right Data and Tools to Use
Kubernetes is the most popular container orchestration platform for providing a wide range of functionalities: auto-scaling infrastructure, self-healing, storage, and more. A 2021 survey conducted by the Cloud Native Computing Foundation (CNCF) found that 69% of respondents are using Kubernetes in production. According to the same survey, there are 3.9 million K8s developers worldwide (a 67% increase from the previous year).
The main challenge with using Kubernetes in production is its complexity. You need to have a good understanding of the different components of your K8s architecture and their dependencies to manage and troubleshoot it effectively. The good news is that Kubernetes offers a lot of information (events, metrics, and logs) out of the box that you can use to improve observability, but ensuring it’s all in the right context is key. This article and the accompanying demo video covers some critical events and metrics to monitor and the best tools to empower developers to troubleshoot faster.
The role of the Kubernetes scheduler
Kubernetes events (the often forgotten telemetry) are helpful for troubleshooting production issues. To monitor events effectively, you first need to know why and how they are created. You should have a good understanding of the Kubernetes architecture and how Kubernetes assigns Pods to a particular Node and allocates compute or memory resources.
The Kubernetes platform’s main components are:
- Control plane: Cluster control components that manage the Nodes and Pods, make decisions about the cluster (Scheduler), and detect and respond to cluster events.
- Node: Machines that host Pods. Nodes offer a set of resources to run Pods and assigned workloads, and configure networks.
- Pod: A group of containers assigned to run on a Node in your cluster. Pods stay on the assigned node until it is executed, deleted, or evicted.
- Kubelet: A service that runs on Nodes. It executes tasks from the control plane, and reports the status of nodes and containers back to the control plane to make informed decisions.
- Kubectl: Command-line interface configuration tool for Kubernetes.
In the Kubernetes world, Pods are ephemeral by nature. They can be created, killed, or evicted by the scheduler (a component in the control plane) based on changes in demand. The Kubernetes scheduler is responsible for assigning Pods to a Node as well as allocating compute and memory resources depending on your application’s changing needs. This is why you might see a message informing you that a node is terminating or a pod has been killed. If a Pod or the Node it executes on terminates, the run-time resources will then be reallocated to other applications or suspended until they’re needed.
This reallocation can happen intentionally or unexpectedly. For example, evicted events are pretty common because Kubernetes automatically adjusts resources based on your needs. However, it’s important to understand why it’s happening and address any underlying cause. Evicted events can signal a problem with resource consumption configuration at the container level. When you don’t define requests and limits parameters, consumption can get out of control.
Why you should care about Kubernetes events
Kubernetes emits events whenever a change happens in any of the resources that the Kubernetes scheduler is managing. The same goes for state changes—like transitioning from pending to running or statuses like successful or failed— which can be frequent in a large Kubernetes deployment. These events often contain metadata about the entity that triggered it, the type of event, and the cause. They give you valuable insight into the health of your infrastructure while giving you context for unexpected behavior.
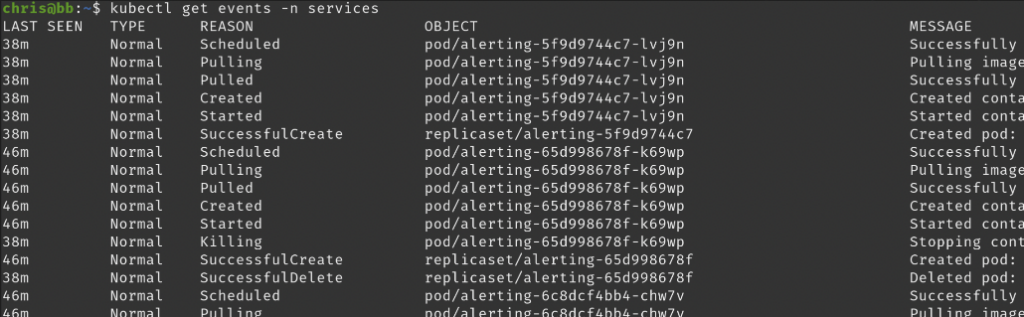
In a default setup, events are stored in etcd, Kubernetes’ primary database. You can access the events when you run specific kubectl commands. Running kubectl get events will give you an aggregate list of events. As you can see below, this gives you details about the entity emitting the event, the type of the event (Normal, Information, or Warning), and what triggered it (Reason). This information is useful when trying to understand changes that are occurring in the system.
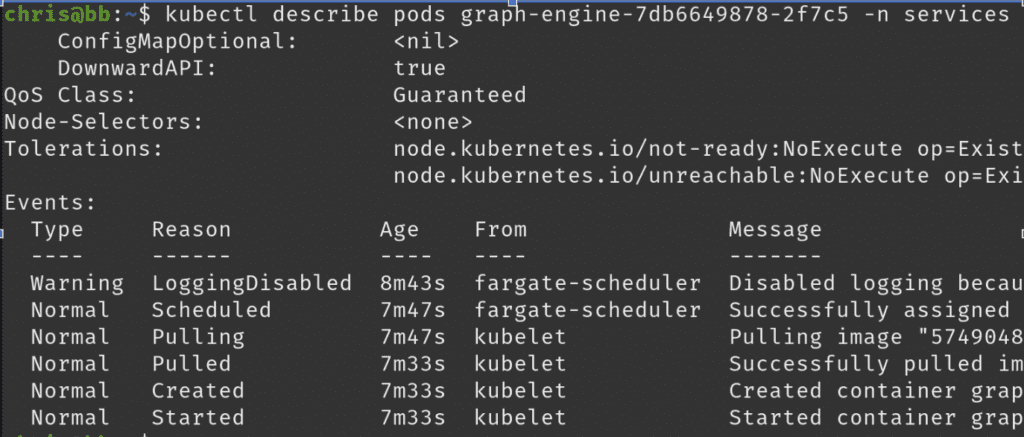
Running kubectl describe pods will help you understand why a Pod is having problems. It shows the detailed status of all the containers and events associated with the Pod. Although this command gives a lot of context, engineers will often need to dig deeper to understand what’s causing the error. That might be looking at your observability tool and checking CI/CD pipelines for recent code deploys.
Kubectl vs monitoring tools
The kubectl output is useful, but it doesn’t help you understand your long-term system performance and reliability. Because Kubernetes keeps events for only an hour before cleaning it, you cannot effectively troubleshoot problems caused by changes made a few hours ago. Sometimes, configuration changes don’t populate into an error right away. If you can’t look in the past, you don’t know what is normal and what led you to the problem.
Monitoring and observability tools, on the other hand, give you historical context of the problem and remove the burden of sorting through the data manually in the command line. Having the historical context helps to understand long-term cluster health, incidents that occurred in the past, and the actions taken to mitigate them so you can create accurate postmortems.
You can use CtrlStack’s platform to connect key events, metrics, and logs over time via the dashboard and correlate the information side by side. CtrlStack is integrated with Slack to give you a recap/summary of events in the system and to let you quickly jump to any event in time to understand what happened. This is especially useful during incident response, allowing different teams (from engineering/SRE to security to your CXO) to get context on the situation fast and collaborate efficiently.
How does CtrlStack provide the best Kubernetes troubleshooting tool?
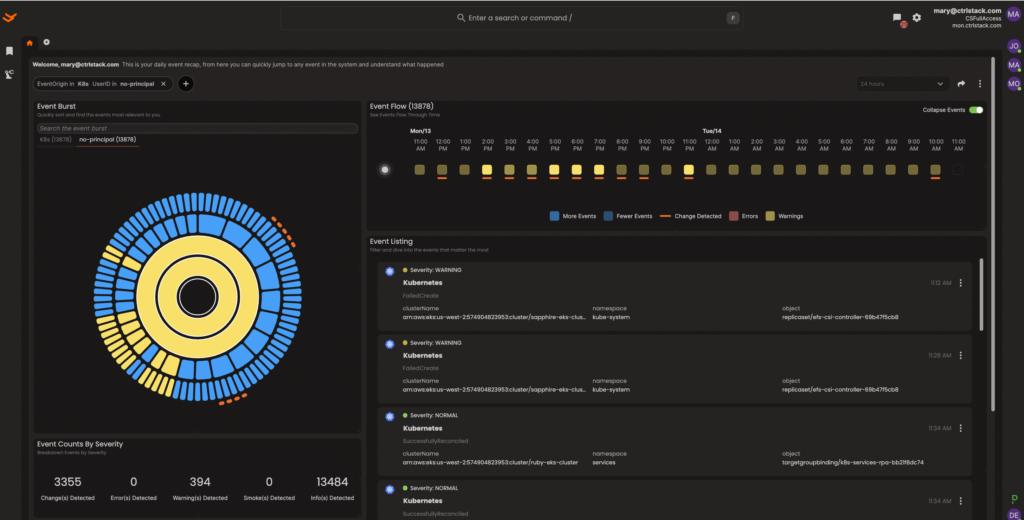
CtrlStack makes it easy for you to capture and unify the relationships of clusters and your stack. When specifically looking at Kubernetes, you can see all the events funneling into your system in real time. From the dashboard below, you can quickly filter events by event type (i.e. Kubernetes events), by a specific time segment, or by event severity. You can dig into the details of the events by clicking on any event listed in the Event Listing pane.
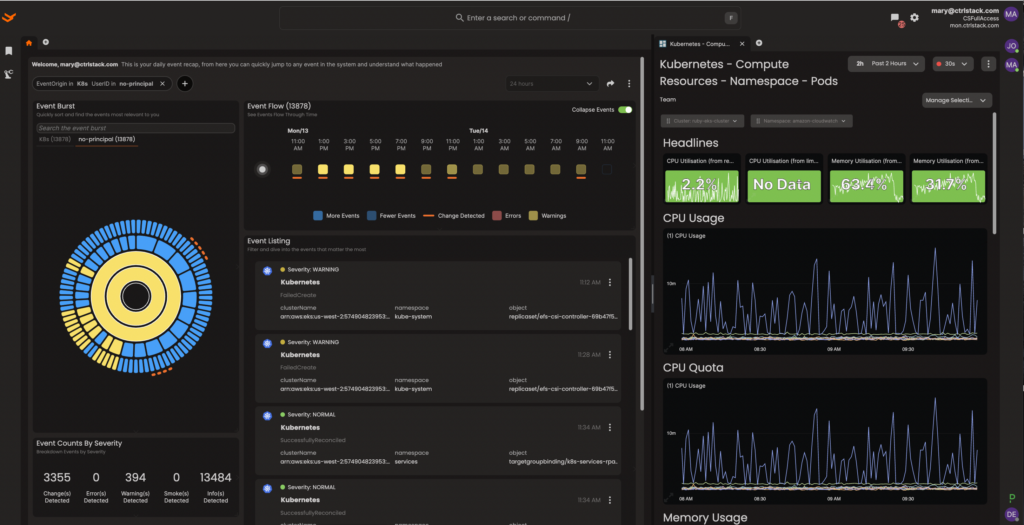
CtrlStack makes it easy for you to troubleshoot production issues by giving you a combined view of events and related metrics. The platform dynamically generates the metrics dashboard and lets you view the data side by side so you can immediately correlate the events and metrics to start your investigation.
No matter where you are in your Kubernetes adoption journey, you’ll run into issues with knowledge gaps and monitoring complexity. Kubernetes requires a learning curve on how to maintain and fine-tune specific features.
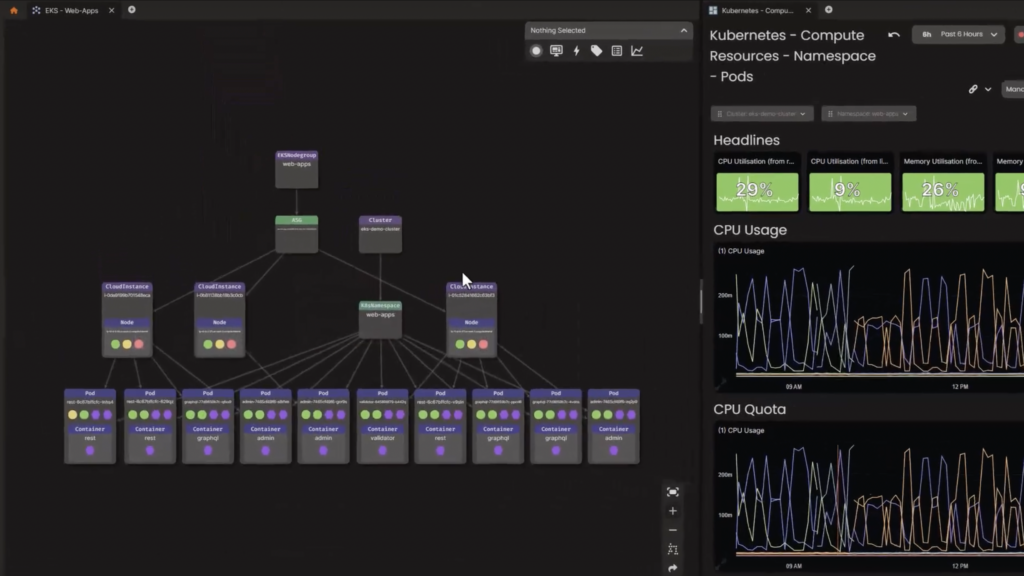
That’s where CtrlStack provides the most value. The platform gives you an accurate topology view of what your Kubernetes architecture looks like, allowing you to learn how the different components are connected and what metrics are tied to them. Because CtrlStack captures the relationships between Pods, Nodes and Namespace, you can quickly view the automatically inferred topology within seconds.
Imagine the time, resources, and headaches saved from not having to manually construct the graph and keeping up with all the dependencies and system changes in your head.
CtrlStack support for EKS
CtrlStack also supports Amazon Elastic Kubernetes Service (Amazon EKS), a service that makes it easy for you to run Kubernetes on AWS without needing to provision and maintain your own Kubernetes control plan. The integration with Amazon EKS means that DevOps teams can simplify Kubernetes management and real-time troubleshooting as you scale.
With Amazon EKS’ integration into CtrlStack, DevOps teams can be confident that they have all the right data and insight to effectively troubleshoot infrastructure problems across AWS and Kubernetes environments. CtrlStack manages user activities and API usage in AWS services via the AWS CloudTrail integration. With the EventBridge integration, it’s easy to configure your internal EventBridge service bus to route events to CtrlStack. Getting comprehensive visibility into your EKS environment in CtrlStack will dramatically reduce troubleshooting time and improve your MTTR.
Join us on March 15 to learn more about our support for EKS. Our experts will give a demo walk-through of the CtrlStack platform and features that can uplevel your entire team’s skill set and close the knowledge gap.
Want to explore how your team can benefit from CtrlStack and Kubernetes? Schedule a demo.