Traceability in Observability — Not What You’d Think
When we hear observability, most of us would think logs, metrics, and traces — the three data inputs most talked about. And most would think traceability in observability is about traces that DevOps teams use during troubleshooting to identify a dependency that’s causing poor performance — that’s not what we’re talking about in this blog.
At CtrlStack, traceability in observability means proactively monitoring how a wide range of changes impact a service’s upstream and downstream dependencies in production, and tracing forward/backward at any time. For example, traceability in the “life of a commit” is integrating pre-production CI/CD data to allow DevOps teams to manage those pipelines, and tracing operational behavior back to deploys and even commits. Even with CI/CD workflows and change management processes, changes can still slip into production and cause incidents. The more aware you are of changes to your infrastructure or code that might have caused an incident, the faster you can resolve the issue.
In my previous post, I talked about a unified timeline that allows developers to trace forward to see change impact upon code deploys. This post looks at leveraging that timeline to trace back to recent changes — the first thing that SREs and DevOps teams look for during incident triage.
Tracing Back for Real-Time Troubleshooting
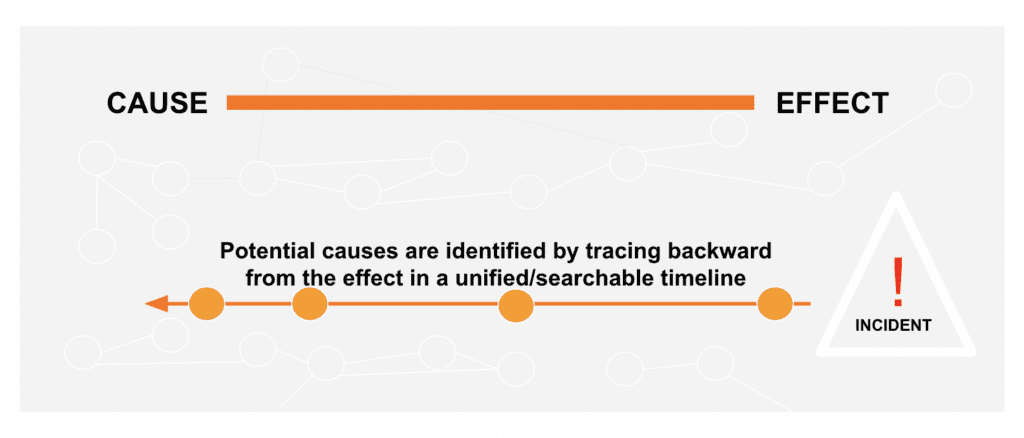
Tracing back is going backward in time to see what caused a metric change. To do this in real-time, the flow needs to bring all (and only) relevant information into a single pane, and be automated with just one click. For example, when you see a spike in a metric chart, you should be able to select any unusual metric and begin investigation with a timeline that shows exactly when the event occurred and which other relevant events happened before that.
Unlike pure time correlation, tying this information together and finding meaningful connections between them requires technologies that construct a real-time graph of the application, infrastructure, and third-party services like CI/CD and PagerDuty. This live graph would get updated every few seconds to incorporate new data and structural changes so change events linked to the metric symptom can be identified easily. When all the changes (across commits, configuration changes and feature flags) are presented in a unified timeline that’s connected to operational data, you can trace forward to the effects and back to the causes. This traceability in observability helps narrow down potential causes, and the information provided for each event helps responders translate the issue into a particular service or team quickly.
Can MELT Data be Used for Traceability in Observability?
Metrics, events, logs, and traces (MELT) that are collected by traditional observability tools are part of the solution. Data alone does not achieve traceability because our data is disjointed. Traceability requires an accurate mapping of the relationships and interactions between the data. The connection between the raw data points — the data between the data — is what turns noise into signal. Our CEO explains this missing link in his recent post.
Don’t traces do that?
Traces, which tell the story of an end-to-end request, are constrained to service requests. There are critical relationships between, for example, a process running in a container running on a node in a Kubernetes cluster that need to be mapped and monitored in order to understand the blast radius of a change, including the infrastructure impacted.
A common approach legacy tools use to represent data relationships is through the use of tags. The issue with tags is that they are inefficient and don’t scale well. With tags, the system has to store and duplicate the full list of connections with every copy of every data point, which cannot be easily or quickly traversed beyond a single hop. As your data grows, your ability to troubleshoot any unusual behavior will be impacted with slow lookup relationships.
Not Just Another Tool for Observability
There are already a number of tools for collecting MELT data, and our team had built one of them, but none quite fit how DevOps would need them to work. Developers need capabilities for tracking and monitoring their services from deployment to production. SREs and DevOps teams need a broader view of all activities that occur including code changes, infrastructure changes, and config file changes. The troubleshooting challenges we face in production are largely caused by the tools we use today; hunting down relevant data in multiple tools requires expertise in different UIs and query languages. Many tools do a poor job allowing us to view MELT data as connected sources of information.
It’s time that DevOps gets a platform — one that developers and operations pros can use for solving production problems fast. A platform that is actionable for DevOps teams should provide the following capabilities:
- System of record for changes — The data of what’s being done to the system must be monitored and tracked. Most incidents are connected to internal changes — actions that would indicate probable root causes.
- Data availability — Metrics, events, logs, and traces need to be accessible on-demand, when troubleshooting or debugging code.
- Context — All teams need to be able to see the information in full context. For example, seeing the metric spike, relevant events over time, and the impacted topology are a must.
- Searchable — Developers should be able to filter the events (by service/errors) and understand change impact within seconds. SREs and DevOps should be able to filter events by source type, such as AWS, Kubernetes, Terraform, PagerDuty, and more.
- Collaboration — Data and knowledge need to be shareable across teams and enable adding annotations.
A DevOps platform that connects all data, including change data, and relationships can significantly enhance teams’ troubleshooting experience. When information is provided in context, and incident triage can be largely automated through a connected graph, we can actually troubleshoot in real time. Reach out to [email protected] to get early access to our beta.