Site Reliability Engineer: Accelerate the Diagnostic Stage of MTTR using CtrlStack’s RCA Dashboard
The role of Site Reliability Engineering (SRE) in any industry is to keep the organization focused on what matters most to customers: ensuring applications and services are available to customers whenever they need them. Specifically, SRE responsibilities can be boiled down to two main functions: Proactive monitoring and systems diagnostics.
According to Catchpoint’s SRE Report, SREs define and track their success using service level indicators and metrics such as:
- Number of incidents
- Mean time to resolve (MTTR)
- Mean time between failures (MTBF)
- Frequency of deploys
- Revenue
In the survey, the service level indicator SREs care about the most is end-user availability. If a service is down, nothing else matters. Given the focus on availability, monitoring and observability tools are an important part of the SRE toolchain for helping software reliability engineers monitor critical systems, collaborate on issues, and respond to incidents as they occur.
Monitoring and Observability Tools
Monitoring and observability tools are important whether they are proprietary, open-source, built in-house, or (most likely) a combination of these. These tools often fall into one of these three categories:
- Application Performance Monitoring (APM) is a suite of tools and processes designed to help operators ensure that enterprise applications and services meet the performance and reliability of customers and partners, with emphasis on the user experience. Technologies that improve the digital experience, such as synthetic monitoring and real user monitoring (RUM), fall within this category. APMs started as metrics-based systems and many have evolved over the years to provide logging and distributed tracing capabilities.
- Log Aggregation helps developers and operators analyze and find errors across many sources of log files. Logs help explain why systems or applications fail.
- Change Intelligence is a new category within the monitoring and observability toolchain. It is a collection of tools and visualizations designed to observe system and application changes (code and configuration changes) and metrics, and show when, where, and what needs to be fixed.
According to the Catchpoint SRE report, the top two uses of monitoring and observability data are alerting on issues and diagnosing systems.
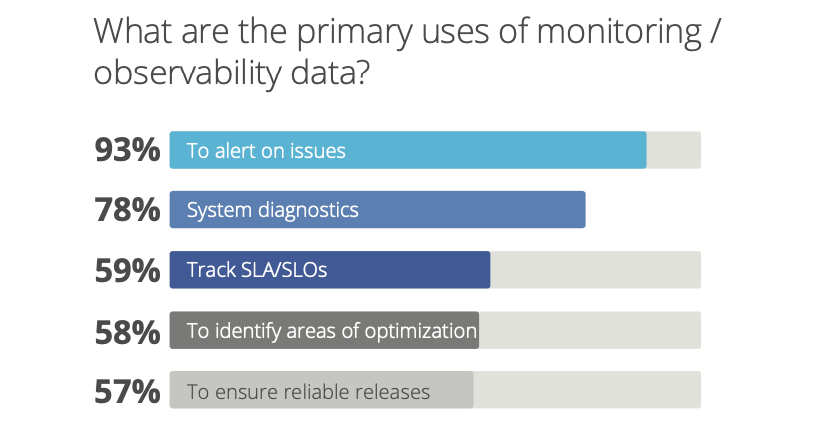
It’s not simply about getting notified quickly; you also need relevant information to diagnose the issue in real time. The majority of time spent when resolving issues isn’t on detection, but on the identification of when, where, and what needs to be fixed. Data needs to be quickly served to determine if an issue is due to the code, the Kubernetes infrastructure, AWS changes, or third-party systems, or some combination of these.
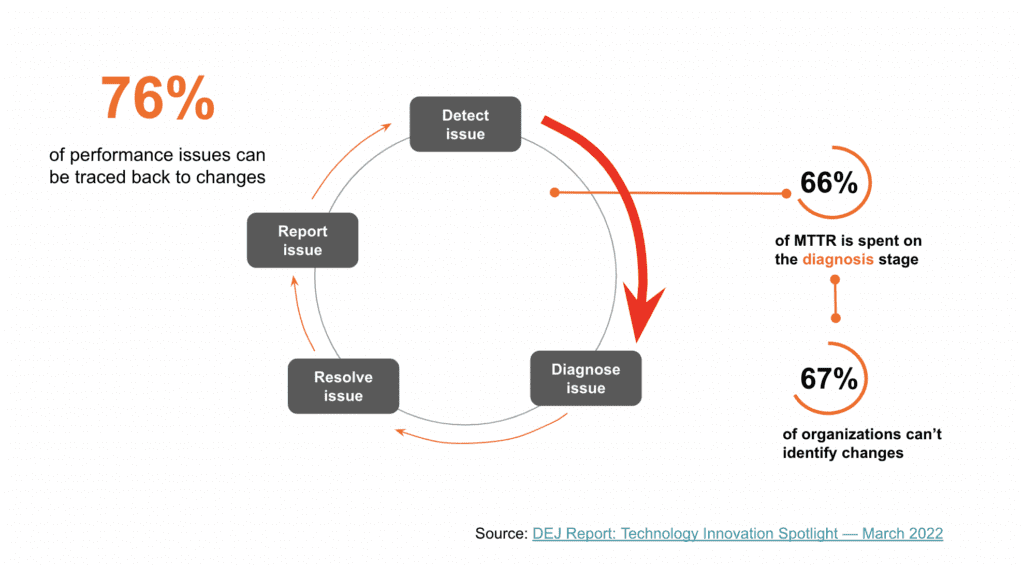
Accelerating the Diagnostic Stage of MTTR
When diagnosing an alert, you need to be able to move from the metric symptoms to the underlying data which indicates the cause. Recent intended changes to your application or system might be the culprit. A best practice is to add change intelligence that informs you of any changes in production. These changes should be surfaced up in your dashboards so they’re easily accessible for troubleshooting production issues.
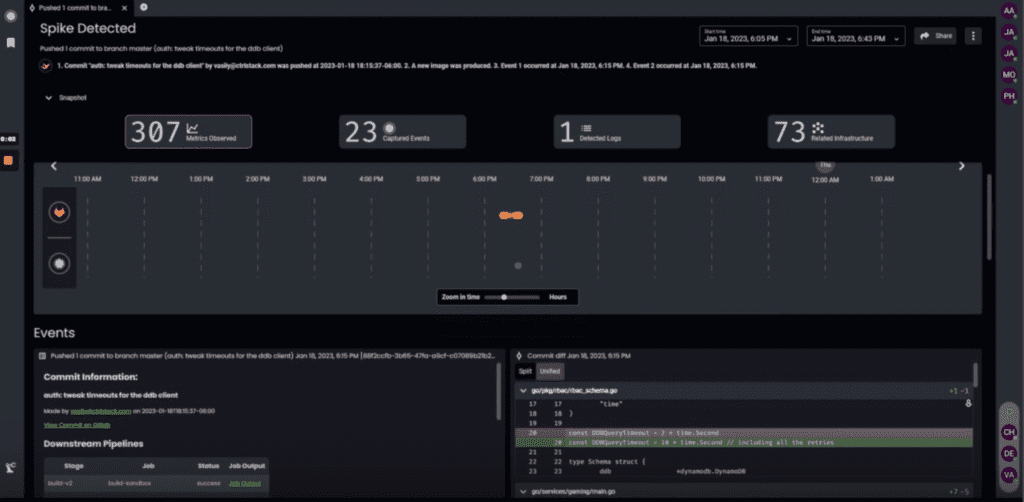
Here’s the screenshot of the CtrlStack RCA dashboard which helps SREs find where, when, and what caused a metric spike.
Even if your service didn’t change, any of its dependencies might have changed, so you should also monitor activities coming from direct dependencies. For example, if you’re running on AWS, you should use both EventBridge and CloudTrail records to extrapolate the metrics as well as user activities and API usage to know which changes impacted your service.
But it’s not enough to just observe changes in AWS. To be efficient in production troubleshooting, here are other sources of change events that are extremely useful for diagnostics:
- Kubernetes events: Events are emitted in Kubernetes when state changes, which can be frequent in an actively developed environment.
- Configuration files: Capturing file change events and presenting them in the context of the problem can significantly reduce the time required to identify the root cause.
- Terraform files: Changes to terraform files trigger calls to AWS APIs, which then emit CloudTrail events.
- CI/CD code deploys: CI/CD pipeline events can be traced back to Git commits and changes in the code.
- SSM/terminal commands: Many systems running in non-container environments are managed via SSM and terminal access.
Because the SRE role is responsible for the reliability of systems and applications in production, it’s important to know where to look and how to find the information you need when on-call. I hope that by pointing out the change information we find useful and why, we can help you explore efficient ways to shorten the diagnostic stage of MTTR.
Check out our introduction to CtrlStack whitepaper to understand how it works, and see how change events and metrics are connected and displayed to help SRE teams diagnose issues faster, which in turn creates a smoother hand-off to other teams.
If you want to see a demo or discuss how we can help improve change visibility and your observability practice, join our beta program. It’s free.