Getting To The Root Of MTTR
Did you miss your favorite NFL team’s comeback win? Was your team left flying blind when your company’s project management tool was down for multiple days? Outages to our most critical services have impacted all of us to varying degrees at one point in time or another. Yet, in those moments, we’re the lucky ones because we’re not on the other side having to diagnose and remediate those outages.
If you’ve been on the other side of the coin, then you know how painful the incident response process can be at times. A 2022 State of Observability report recently showed that the pain felt by service-impacting issues, such as loss of revenue, reputation, and customers, are all on the rise in 2022. If that wasn’t enough, that same report shows soft costs, such as turnover and increased internal friction between stakeholders, have also risen 12% year-over-year. That’s no surprise given the burden we’ve all felt managing complex systems across disconnected tools with colleagues varying in experience.
So should you start making immediate changes to your incident response process in order to reduce the pain felt by customers, colleagues, and upper-management? As tempting as that may sound, it’s important that you first define your performance baseline through Incident Management metrics. This enables you to truly assess whether those changes you implement have a positive impact. While there are many MTT metrics you can generate, of which I will cover several in a follow-up article, I want to focus on MTTR.
What is MTTR?
Incident Management metrics, such as Mean-Time-To-Recover (MTTR), aim to collect the durations for the various phases of incident management and aggregate them over multiple incidents and time. This creates the baseline for teams to evaluate against before and after changes are made to the incident response process.
While MTTR is the most popular of the Incident Management metrics to start capturing, it’s also the most unclear due to it having several different meanings in the DevOps space. Let’s cover the 4 most popular definitions: MTT Recovery, Respond, Repair, and Resolve.
Mean Time To Recovery
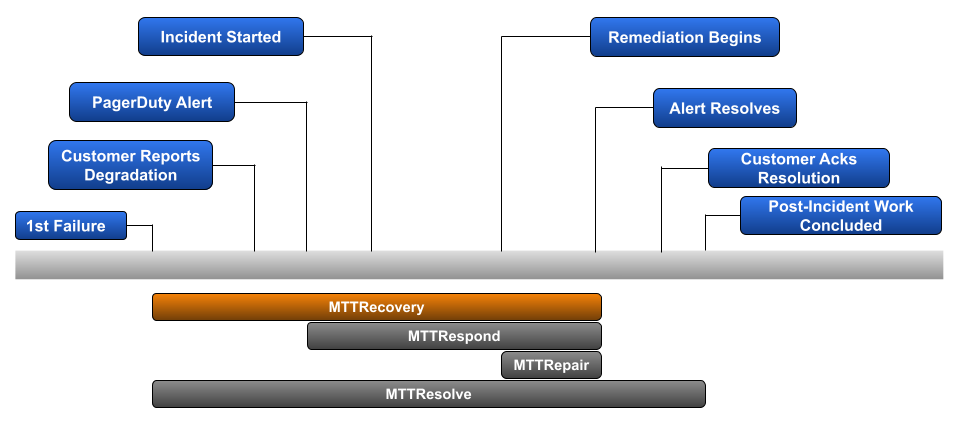
Mean Time To Recovery is the most popular of the various MTTR metrics. It begins when the 1st failure of your service occurs, and ends when that service is back in a fully-functional state. It’s an obvious metric to track for those organizations that primarily care about the impact an incident has on their customers.
A major reason why Mean Time To Recovery is so popular is that it doesn’t require additional structure to be in place to track it. Other MTTR metrics require structure for capturing customer reported degradation, robust alerting for various failure points, and tracking of post incident work in order to avoid that same type of incident from likely occurring again. In many cases, teams may not be able to identify the timestamp for 1st failure until a deeper post incident RCA is completed.
Example: You’ve had 3 incidents in the last week. The duration from 1st known failure to returning to a fully functional state for each incident is 120-minutes, 300-minutes, and 192-minutes.
Calculation: ((120 + 300 + 192) / 3)
Mean Time To Recover: 3h 24m
Mean Time To Respond
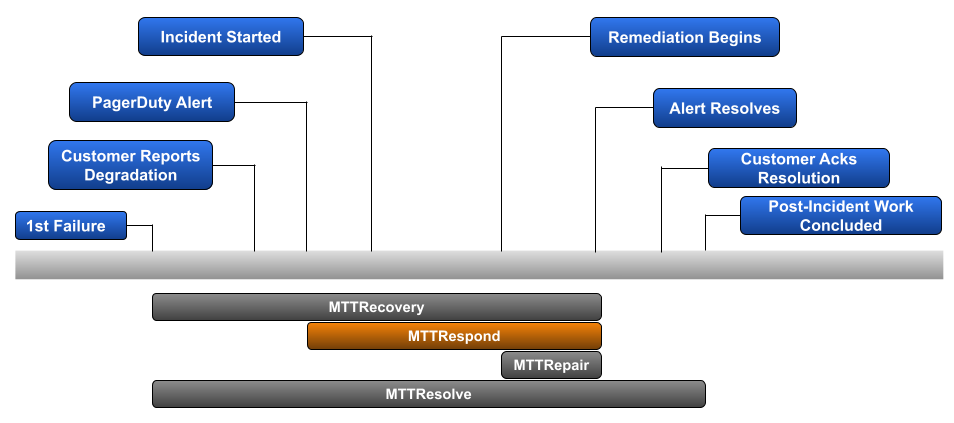
But what if your team knows there is a process gap for surfacing 1st failures and beginning the troubleshooting portion of an incident? This could mean a lack of robust alerting or a reliance on a less technical team to route customer issues to the right on-call team. In that case, it makes sense to capture Mean Time To Respond, which replaces ‘1st failure of service’ with ‘1st alert of failure’.
If your goal is to improve the troubleshooting and remediation portion of an incident, then Mean Time To Respond is the route you should take.
Example: Our previous scenario highlighted 3 incidents in a given week with a duration of 120-minutes, 300-minutes, and 192-minutes. Let’s assume that each of these incidents included 45-minutes between 1st failure and the team the proper on-call team was alerted to the issue.
Calculation: (((120–45)+(300–45)+(192–45)) / 3)
Mean Time To Respond: 2h39m
Mean Time To Repair
The National Institute of Standards and Technology (NIST) breaks down an incident into 4 phases:
- Preparation
- Detection and Analysis
- Containment, Eradication, and Recovery
- Post-Incident Activity
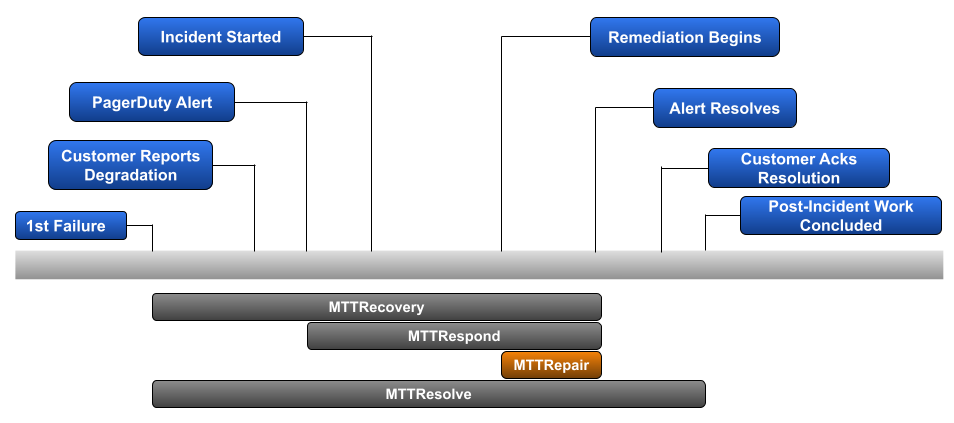
Mean Time To Repair focuses on the 3rd phase — Containment, Eradication, and Recovery. More clearly said, once the root cause of an observed problem is known, how long does it take your team to remediate and return back to a fully functional state?
Example: Back to our prior scenario, eliminating the duration between 1st failure and 1st alert resulted in 3 incidents lasting 75-minutes, 255-minutes, and 147-minutes. For each, the troubleshooting phase lasted 30-minutes, 120-minutes, and 60-minutes, respectively.
Calculation: (((75–30)+(255–120)+(147–60)) / 3)
Mean Time To Repair: 1h29m
Mean Time to Resolve
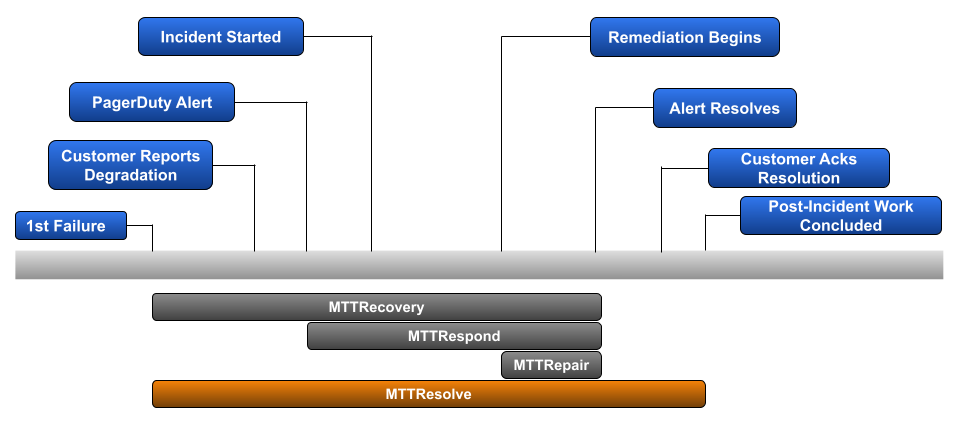
Mean Time To Resolve is the only MTTR discussed in this article that tracks the post-incident work necessary to help avoid a similar issue from occurring again in the future. While fixing the issue at hand should be the number one objective in order to get your customers back up and running, spending the necessary amount of time to mitigate that issue from likely happening again helps to improve overall customer sentiment regarding your company and the service you provide your customers. For that reason, Mean Time To Resolve can be an excellent incident metric to build your baseline on. Note that the process of capturing the duration for post-incident work can vary between organizations based on business hours. For example, completely different durations can be calculated for teams that only work Monday thru Friday, teams that run skeleton crews over the weekend, and teams that have around-the-clock coverage.
Example: Our original scenario included 3 incidents of 120-minutes, 300-minutes, and 192-minutes. Let’s assume that each incident included 60-minutes, 30-minutes, and 90-minutes of post-incident work, respectively.
Calculation: (((120+60)+(300+30)+(192+90)) / 3)
Mean Time To Resolve: 4h24m
Challenging Your MTTR Baseline
If you’ve selected the MTTR metric best suited for your organization and created a performance baseline, then it’s time to start addressing any problem areas you’ve identified in your incident response process. The following are just a few examples you could consider:
- Add recap sessions into the on-call rotation changeover to better inform teams about past or potential issues;
- Consolidate tools and solutions that are utilized to troubleshoot incidents in order to reduce context switching;
- Incorporate automation workflows early in the process in order to reduce human error and more quickly identify potential root causes;
- Introduce Incident Commanders and Scribes so on-call members can focus on diagnosing the issue(s) at hand;
- Create a shadow on-call rotation for a 2nd level of support during peak business hours.
If you feel like you’re hitting a wall when attempting to identify potential improvements to make, then learn how we believe teams should embrace change in production to improve MTTR.
After you’ve allowed some time for your improvements to be tested, then generate your post-change MTTR baseline and compare it to your pre-change baseline. This should help you to determine whether your changes are actually improving the incident response process.
While MTTR is the most popular starting point for evaluating Incident Management metrics, there are others you should consider baselining as well. In an upcoming article, I’ll cover some of these additional Incident Management metrics you should consider, and identify areas for improvement you can focus on.